.jpg "Special Electoral Falsification: What the State Duma election results reveal about the political situation in Russia")
Special Electoral Falsification: What the State Duma election results reveal about the political situation in Russia
The preliminary results of the Duma elections released by the Central Election Commission (CEC) show that the electoral hierarchy made every effort to fulfil the task set by the Kremlin. After Vladimir Putin effectively framed the election as a vote of confidence in his agenda of military escalation, the required regional voting results were raised to levels approaching the 60/60 formula, namely 60% of the vote for United Russia with turnout of around 60%.
Meanwhile, an analysis of the results using the ‘Shpilkin’ method reveals a record gap between the core of what appears to be normal voting and the CEC’s reported figures. Within the core, where turnout stands at 28–42%, United Russia’s result is close to 33%. This means that, across Russia as a whole, almost 40% of the votes supposedly cast for the party are fraudulent, amounting to the highest level of electoral fraud in the history of Putin-era elections since 2003.
As for the other parties, Re:Russia’s analysis shows that in the cluster of protest votes in Moscow, where United Russia received 25% of the vote, the Communists secured 30% and New People 23%. However, in the nationwide data adjusted for electoral fraud, the Communist Party of the Russian Federation (CPRF) received 25%, New People 14%, the Liberal Democratic Party of Russia (LDPR) 13%, and A Just Russia 8%. Thus, anti-establishment sentiment across the country as a whole has a different, much less modernising profile than in the capital.
The Kremlin’s attempt to turn the Duma elections into a demonstration of total public support for Putin’s course of military escalation, despite evidence that public opinion is instead demobilised and wants the war to end, succeeded in form but not in substance. Its nominal success required fraud on a record scale. And this picture of the desired result being crudely forced through reflects, to a certain extent, the political situation in the country: the Kremlin, and above all Putin himself, backed by the security bloc within his circle, is insisting on a ‘hard line’ despite not only prevailing public sentiment but also the views of a significant part of the civilian bureaucracy. This was evident, in particular, in the confrontation between two Kremlin scenarios for conducting the current election.
At the same time, although the Kremlin’s political course has diminishing support among the population, the means available to resist it are extremely limited, and discontent has not yet reached a critical level. Moreover, as our analysis shows, the profiles of opposition to ‘Putin’s course’ in Moscow and in the regions differ to some extent, which will also hinder the consolidation of opposition sentiment.
Authoritarian KPI
As we anticipated in our analysis of the 2026 election campaign (→ Re:Russia: Putin Has Made the People’s Choice), once Vladimir Putin decided in late August to give the campaign a mobilisation-oriented character, using the vote as a demonstration of electoral support for his course of military escalation, the administrative machinery was instructed to ensure high turnout and a strong vote for United Russia at any cost.
The election results currently reflected in the CEC data are consistent with the logic of authoritarian management of electoral outcomes discussed in our analysis. As early as the beginning of the ‘election campaign’ in the spring of this year, the Presidential Administration envisaged that the election should produce a convincing victory for United Russia, with indicative results of 55/55, meaning 55% of the vote for United Russia with turnout of around 55%. This authoritarian KPI was communicated to regional administrations.
However, in June–July, against a backdrop of a deteriorating economic situation, the increasing intensity of Ukrainian attacks on Russian oil refineries and Wildberries warehouses, public scepticism regarding the ‘successes of the special military operation’, and the petrol crisis, public sentiment deteriorated sharply, whilst the government’s approval ratings fell significantly (→ Re:Russia: August Sociology). The proportion of those who believed that events in the country were moving in the right direction averaged 72% over the first five months of the year, but fell to 54% during the summer (Levada Centre polls). Meanwhile, support for United Russia in FOM’s weekly surveys fell from an average of 42% in late 2025 and through February 2026 to 33% in late summer and early autumn (the absolute figures should not, however, be taken literally: the polling sample is highly likely to be skewed towards a more loyal audience, whereas the shift itself, namely the decline in the figures recorded within this sample, represents a significant change).
As a result of such a marked deterioration in voter sentiment, the authoritarian KPI, namely the target set for regional administrations for delivering the required election results, was lowered by the Presidential Administration to the 45/45 formula: 45% for United Russia with turnout of around 45%. At this point, the ‘pharmacy’, as Putin’s administration is reportedly known among regional administrations according to Meduza, placed the emphasis on the legitimacy of the election. This meant aiming for a moderate scale of fraud so that the announced results would appear at least relatively plausible to voters and the election would not become overly controversial. However, the actual scale of electoral fraud and the almost final results reported by the CEC indicate that, at the final stage of the campaign, the political significance Putin assigned to the vote prompted a change of approach. The KPI was not only restored to the original target but, judging by the evidence, was raised further to a benchmark of 55+ / 55+.
Interestingly, even the Kremlin-approved polling organisations were not prepared for this turn of events. For instance, a week before the vote, FOM’s forecast underestimated United Russia’s share of the vote by almost 10 percentage points. It put the party at 47–49%, with turnout at 54%. Meanwhile, the forecast by the pro-government VTsIOM is based on an interim, inflated KPI of 50/50. The ExtremeScan poll stands apart, as its estimate for United Russia is the closest to the non-fraudulent ‘core’ of the vote (see below). The errors in the FOM and VTsIOM forecasts are themselves evidence that, among the Kremlin-adjacent ‘planners’ of the election, the new requirements for demonstrating support for the party were regarded as ‘over the top’, that is, unrealistic.
Table 1. Polling forecasts of election results and preliminary official results from the Central Election Commission, %
Normal and anomalous: assessing the scale of fraud
Statistical analysis of the voting results, conducted by electoral data analyst Pyotr Zhizhin using the ‘Shpilkin’ method (developed by Sergei Shpilkin, an expert in electoral statistics and a physicist), makes it possible to estimate both the absolute scale of electoral fraud and the approximate distribution of the vote after removing most distortions. As a reminder, the ‘Shpilkin’ method involves the statistical detection of anomalous voting and can identify ‘ballot stuffing’ in favour of a party or candidate. Under genuine voting conditions, the distribution of ballots cast for a particular electoral participant follows the rules of a normal distribution: most polling stations form the statistical mode for turnout and votes for a particular party, while the number of polling stations with higher or lower turnout and vote shares declines as the deviation from the mode increases, forming a Gaussian curve. When ballots are stuffed in favour of a particular party or candidate, a ‘comet tail’ effect emerges: turnout and the share of votes cast ‘for’ the participant increase proportionally. During the first half of Putin’s rule, roughly until the 2016 elections, fraud was concentrated in a limited number of polling stations. As a result, scatter plots, in which each polling station is represented by a point, clearly showed a relatively honest voting ‘core’ and a ‘comet tail’ consisting of polling stations with varying degrees of electoral fraud, from moderate to blatant.
However, by the time of the 2018 presidential election, and subsequently during the 2020 constitutional amendments vote and the 2021 parliamentary elections, the situation had changed. First, from 2018 onwards, the mobilisation of voters to polling stations by the authorities became a significant factor. This differs from ballot stuffing because these voters nevertheless cast ballots in different ways, although they display a higher proportion of conformist votes for the incumbent or the ‘party of power’. Second, in his analysis of the 2020 and 2021 votes, Shpilkin noted that the relatively honest voting ‘core’ was becoming increasingly narrow and diffuse, while the ‘comet tail’ was increasingly ‘wagging the dog’, meaning that the number of polling stations with falsified results, or anomalous votes, exceeded the number of normal polling stations (→ Shpilkin: The Tail Wags the Comet; Shpilkin: Anomalous and Normal).
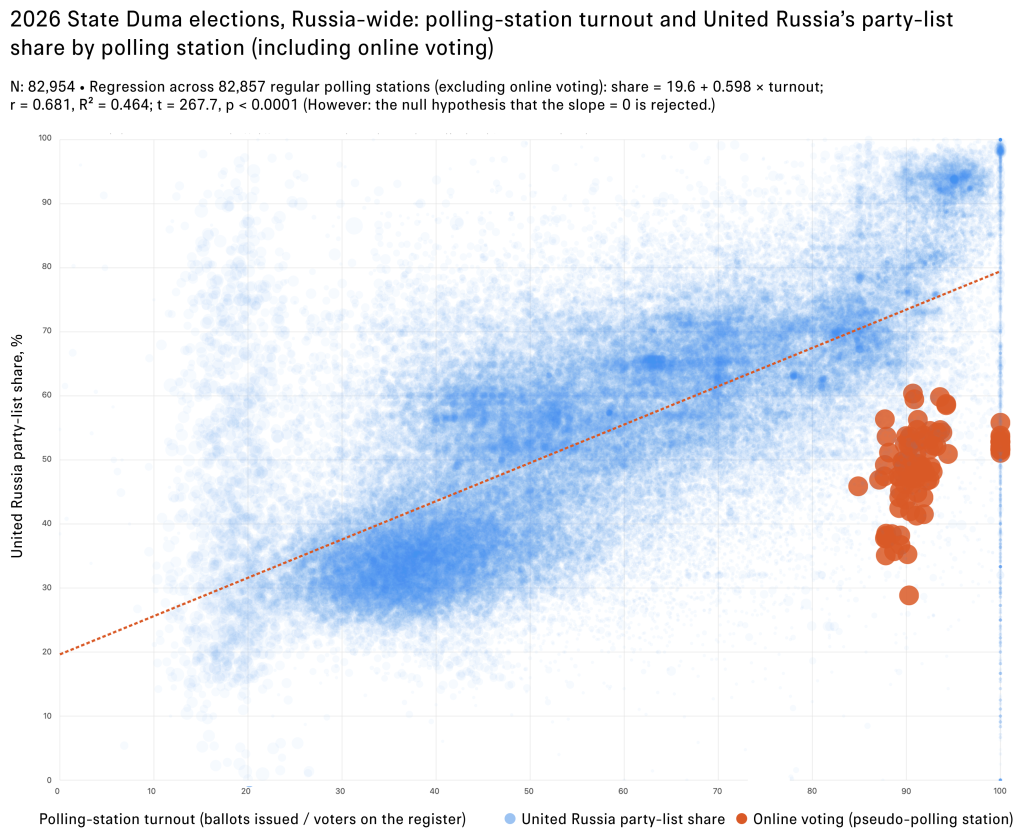
Nevertheless, the Zhizhin–Shpilkin scatter plot of polling stations by turnout and the result for United Russia shows several clusters (Figure 1). The first is concentrated around a turnout of 28–40+%, with United Russia receiving between 28% and 38% of the vote, slightly below the 30–40% range. This is the so-called ‘core’, representing the results from polling stations without significant electoral fraud.
Figure 1. Turnout and votes for the United Russia list in the 2026 elections
Source: deg.zhizhin.xyz
The second cluster is observed in the 40–55% turnout range, where United Russia receives 50–60% of the vote. Here, there is a noticeable effort by the Precinct Election Commissions (PECs) and Territorial Election Commissions (TECs) to exceed the 50% mark for United Russia, visible as a distinct horizontal concentration of results. This second cluster lies slightly above the regression line, meaning that votes for United Russia increase faster than turnout. It can be assumed that this cluster includes polling stations where organised mobilisation of voters took place on the first day of voting. Less highly skilled employees of large enterprises, including, for example, defence industry plants, may readily vote ‘for the authorities’, but are less disciplined about turning out, preferring fishing and other leisure activities on their days off. If, however, they are required or organised to travel to polling stations on Friday, the desired result is achieved almost automatically.
The third range lies at 60–70% turnout, with a marked concentration of United Russia’s result at around 65%. This represents another elevated KPI achieved by the leading practitioners of electoral fraud. Two further concentrations can be identified at the intersection of 85% turnout and a 70% result for United Russia, and at the point where turnout and United Russia’s result both reach 95%. These clusters consist predominantly of polling stations in Dagestan and Chechnya, but also include individual districts in Tatarstan and Buryatia, as well as the Samara, Voronezh and Tyumen regions (on the ‘bear’s corner’ effect in Russian electoral geography → Rogov: One and a Half Russias). This area of electoral fraud lies above the regression line, indicating that not only was turnout inflated through ballot stuffing, but votes cast for other parties were also attributed to United Russia. Its result therefore ‘grows’ faster than turnout. Technically, ballots were most likely not counted at all in these areas, or the actual counts were disregarded, with the results simply being fabricated at the level of the TEC or the region.
The red dots on the diagram represent the results of electronic voting, and here we observe a broadly similar pattern. Turnout in this segment is high because it is calculated based on voters registered for electronic voting. However, in the 85–90% turnout cluster, the United Russia list receives 28–38% of the vote, as in paper voting. The next cluster, in the 90–95% turnout range, extends upwards from 40% to 55% for United Russia. It can be assumed that the scope for ‘ballot stuffing’ was limited here, since this would first require the registration figures for electronic voting to be falsified. Instead, votes were simply reassigned, meaning that a vote cast for another party was attributed to United Russia. Neither voters nor even election commissions overseeing electronic voting can subsequently verify how an individual vote was recorded in the final distribution.
Overall, the ‘Shpilkin’ method makes it possible to estimate the share of anomalous votes, with the exception of votes that were directly reassigned from one party to another and the effect of administrative mobilisation of voters. The historical series of such estimates shows that many media outlets were mistaken in claiming that the 2026 election set records for both turnout and the share of votes cast for United Russia. First, the actual records were set in 2007, when turnout and the share of votes for United Russia’s federal list stood at 63.7% and 64.3%, respectively. Second, a record does appear to have been set in 2026, but of a somewhat different kind. As Figures 3 and 4 show, the current vote produced a record share of fraudulent results. In terms of fraudulent turnout, estimated at 36% of all supposedly participating voters, this election fell just short of the 2020 benchmark, the constitutional amendments vote, when 37% of purported voters were estimated to have been fictitious. However, the 2026 election set an absolute record for the scale of fraud benefiting the pro-government candidate, namely United Russia, accounting for almost 40% of all votes supposedly cast for the party. In other words, at least two out of every five votes recorded by the CEC as having been cast for United Russia are fraudulent.
Figure 2. Official and estimated actual results of parliamentary and presidential elections and the vote on constitutional amendments (‘Shpilkin’ method), 2003–2026, %
Figure 3. Proportion of anomalous and genuine votes in the results of elections and the referendum on constitutional amendments (‘Shpilkin’ method), % of official data
The Moscow ‘column’ and distributions close to normal
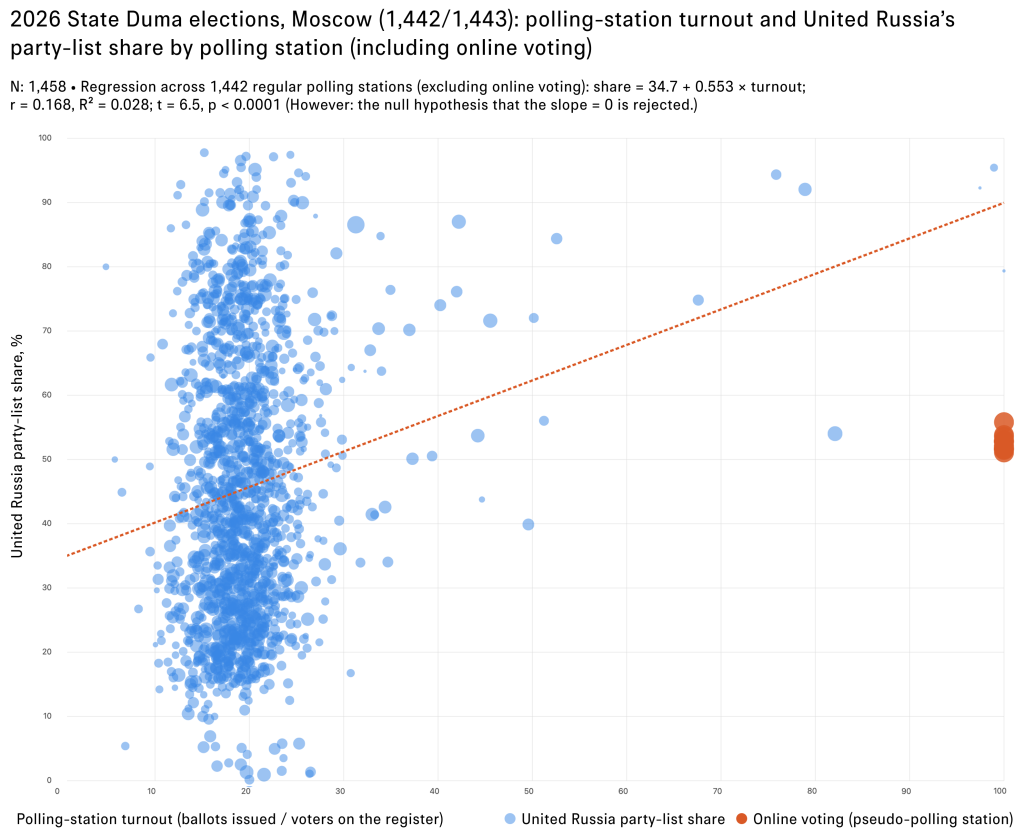
Finally, Figure 1 draws attention to a strange, dispersed ‘column’ of polling stations at turnout levels of 15–20% and above, where, despite similar turnout figures, United Russia received between 15% and 80% of the vote. This data consists predominantly of results from ‘paper’ voting at polling stations in Moscow. The exceptionally low turnout is explained by the dominance of electronic voting in Moscow: according to CEC data, 3.3 million people (79%) ultimately voted electronically, while only 900,000 (21%) used paper ballots. It is the latter that form the anomalous Moscow column, which has not previously appeared in electoral statistics: the share of ‘paper voters’ casting their ballots for United Russia varies across an unprecedented and implausible range.
Figure 4. United Russia’s results in ‘paper’ and electronic voting in Moscow
Source: deg.zhizhin.xyz
Such a wide spread appears all the more unnatural given that the variation in United Russia’s results across the 16 electronic voting constituencies (red dots) is, by contrast, implausibly small, at 51–56%. This suggests that Muscovites who voted electronically have highly homogeneous preferences, while those who voted at polling stations have diametrically opposed preferences depending on where they live. This anomaly requires separate analysis. However, preliminary estimates show that, among PECs, the share of ‘upper’ polling stations where United Russia received 70–80% of the vote was around 37% in the Novomoskovsky constituency, 26% in Kuntsevsky, and 17% in Babushkinsky. These are outlying districts of the city with a traditionally conservative, pro-government voting profile. By contrast, no polling stations with this distribution were found in the Tushinsky, Khovrinsky and Central constituencies. Conversely, the share of PECs in the ‘lower’ cluster, where United Russia’s vote share ranges from 20–30%, reaches 45% in Tushinsky, 39% in Medvedkovsky and 35% in Chertanovsky constituencies (Re:Russia calculations based on Pyotr Zhizhin’s raw data, using GPT-5.6 Sol, OpenAI).
That said, the variation remains substantial even within individual constituencies, so the issue requires further investigation. As a hypothesis, however, one can assume that the upper end of the range reflected both organised mobilisation of employees at large enterprises and ballot stuffing, including the reassignment of votes from other parties to United Russia (organised mobilisation of voters can, in itself, produce an elevated share of votes for the party of power in the range of 50–60%, but it cannot produce a ‘Caucasus-style’ result of 80–90%). Conversely, the lower end of the range consists of protest constituencies, where voters turned out specifically to avoid casting their votes for United Russia. Overall, on paper ballots in Moscow, United Russia received 47%, the CPRF 20%, and New People 14%. Within the upper pro-government cluster, the respective results were 75%, 8.8% and 4.6%, while in the lower ‘protest’ cluster, United Russia received 25%, the CPRF 30% and New People 23%, with the LDPR and A Just Russia receiving 6% and 5%, respectively.
Organised voting in polling stations in the ‘upper cluster’ most likely took place on Friday, when there were particularly few observers at polling stations, while protest voting took place on Sunday (on the final day of voting, 20 September, the research group ExtremeScan conducted a nationwide telephone exit poll, which, among other findings, showed that 42% of voters had voted on the first day, Friday, including 58% of public-sector employees, 35% of private-sector employees, and 26% of entrepreneurs and self-employed people.) Apparently, once election commissions and the CEC realised that the scale of Sunday’s protest voting had become substantial enough to outweigh the ‘upper cluster’, pushing United Russia’s overall result below 50%, the distribution of paper ballots at polling stations in Moscow was halted.
The results of the two Moscow voting modes raise another important question about the election results: how, given the low levels of distortion, were the votes which were not cast for United Russia, or more precisely, were cast against it, distributed more broadly? The lower cluster of Moscow’s ‘paper’ vote provides a picture of protest voting, where people deliberately went to polling stations to cast their vote against the authorities and against the war, without exposing it to the risk of electronic manipulation. These were participants in tactical voting, which the opposition had encouraged. The outcome of their efforts is reflected in the distribution cited above: United Russia’s share fell to a quarter of the votes cast, while the CPRF and New People together received 53%. But what does the distribution look like across Russia as a whole when distortions caused by ballot stuffing and other forms of electoral fraud are removed?
Analysis of the cluster of polling stations with the fewest anomalous votes on the nationwide chart (Figure 1) allows us to see such an average distribution. We defined the ‘core’ as all polling stations where turnout fell within the 28–42% range and United Russia’s result was between 27% and 38%. This sample comprised 7,441 PECs, where 4.071 million voters cast ballots whose choices were most likely not distorted by electoral fraud, representing approximately 6% of the 63 million officially recorded voters, or 10% of the estimated 38.5 million people who actually voted. Among these 4 million voters, United Russia received 33% of the vote, the CPRF 25%, New People 14%, the LDPR 12.5%, and A Just Russia 8%. In other words, the Communists are virtually level with United Russia, New People perform considerably worse than in Moscow’s protest vote, while the LDPR and A Just Russia perform noticeably better. Thus, although United Russia lost 45% of the votes attributed to it by the CEC in this sample, anti-government voting across the country as a whole has a substantially different and less ‘modernising’ profile than in the capital.
Table 2. Distribution of votes for the main parties at polling stations with minimal levels of fraud and in the CEC’s data
Chart 5. Distribution of votes for the main parties at polling stations with minimal levels of fraud and in the CEC’s data, %
As we can see, the Communist Party lost the most in terms of votes diverted to improve United Russia’s result, with more than 40% of their votes effectively taken away. However, in percentage terms, New People lost roughly the same share of their votes to the benefit of the party of power. The LDPR fared better, with less than 30% of its votes taken away. A Just Russia failed to reach the 5% threshold: TECs and regional authorities took votes from the party to help meet the KPI for United Russia. However, the party was subsequently ‘given back’ votes on instructions from the Kremlin. Meduza, citing its sources, claims that the decision over which parties enter the Duma is made personally by Putin.
From the Kremlin’s perspective, it was also crucial to keep New People in fourth place, despite the fact that the party outperforms the LDPR in every relatively ‘clean’ constituency. The party’s success would have elevated the anti-war agenda: following the removal of Yabloko, New People were perceived as the most anti-war party. Informed Re: Russia sources say that the security services strongly insisted on suppressing its result.
Preliminary conclusions
This analysis of the results of the election, as well as the scale and nature of electoral fraud, is preliminary. It does not include either a detailed examination of the results of electronic voting and the mechanisms through which they may have been distorted, or an analysis of voting in single-member constituencies. Here, the CEC results show an almost total victory for United Russia and its aligned candidates, and a complete defeat for the Yabloko list and the opposition’s joint recommendations, including those of the Anti-Corruption Foundation (FBK) and Maxim Katz.
Despite the significance of the latter initiative, according to our purely preliminary assessment, its electoral impact was not particularly substantial. This was likely due to the weakness and short duration of the campaign in support of it. A certain segment of the Russian electorate responded to its message, but its size was not sufficient to pose a serious threat to the electoral fraud machinery. Nevertheless, the 2026 Duma campaign demonstrated overall that the relocated opposition is capable of influencing political processes inside the country, but needs stronger and more effective instruments.
The Kremlin’s attempt to turn the Duma elections into a demonstration of total support for Putin’s course of military escalation, despite multiple indications that public opinion is instead demobilised and wants the war to end, succeeded in form but not in substance. Its nominal success required an unprecedented scale of electoral fraud. This picture of the crude ‘fabrication’ of the required result also reflects, to some extent, the broader political situation in the country: the Kremlin, and above all Putin himself, backed by the security bloc within his circle, is insisting on a ‘hard line’ despite not only prevailing public sentiment but also the views of a significant part of the civilian bureaucracy. This faction is demanding the required result regardless of the reputational costs. Our informed sources corroborate Re:Russia’s assumption that the FSB’s Second Service has acquired significant powers over the management of the ‘electoral process’ during this election, pushed for a hard-line scenario of manipulating the voting results, and is engaged in a struggle for influence with Sergei Kiriyenko, the Deputy Head of the Presidential Administration, who is formally responsible for the elections.
Our analysis also suggests that, although the Kremlin’s political course has diminishing support among the population, the means available to resist it are extremely limited and discontent has not yet reached a critical level. Finally, a preliminary in-depth analysis of the voting results indicates that opposition to ‘Putin’s course’ may have somewhat different profiles in Moscow and in the regions, which will also hinder the consolidation of opposition sentiment.